Archivo:AntarcticBedrock.jpg

Tamaño de esta previsualización: 600 × 600 píxeles. Otras resoluciones: 240 × 240 píxeles · 480 × 480 píxeles · 768 × 768 píxeles · 1024 × 1024 píxeles · 1400 × 1400 píxeles.
Ver la imagen en su resolución original (1400 × 1400 píxeles; tamaño de archivo: 509 kB; tipo MIME: image/jpeg)
Historial del archivo
Haz clic sobre una fecha y hora para ver el archivo tal como apareció en ese momento.
| Fecha y hora | Miniatura | Dimensiones | Usuario | Comentario | |
|---|---|---|---|---|---|
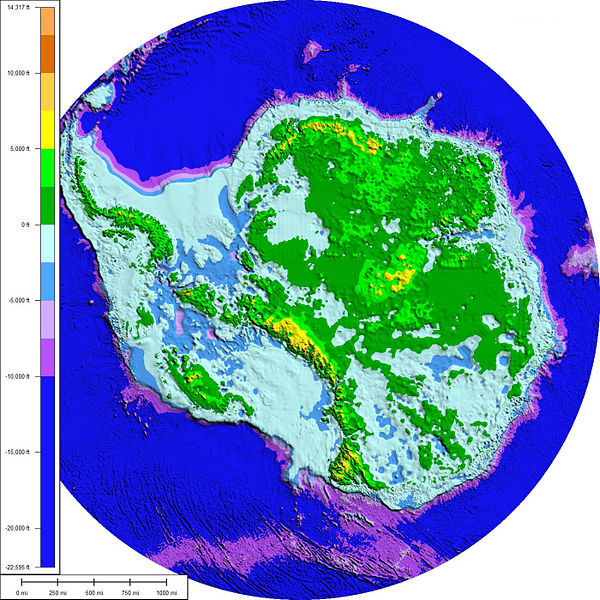
| actual | 04:03 28 ago 2008 |  | 1400 × 1400 (509 kB) | Cristellaria | == Summary == {{Information |Description=The above map shows the subglacial topography and bathymetry of Antarctica. As indicated by the scale on left-hand side, the different shades of blue and purple indicate parts of the ocean floor and sub-ice bedrock |
| 03:58 28 ago 2008 |  | 1400 × 1400 (509 kB) | Cristellaria | {{Information |Description= |Source= |Date= |Author= |Permission= |other_versions= }} | |
| 20:16 13 mar 2008 |  | 1400 × 1400 (515 kB) | Cristellaria | {{Information |Description=The above map shows the subglacial topography and bathymetry of Antarctica. As indicated by the scale on left-hand side, the different shades of blue and purple indicate parts of the ocean floor and sub-ice bedrock, which are be |
Usos del archivo
Las siguientes páginas usan este archivo:
Uso global del archivo
Las wikis siguientes utilizan este archivo:
- Uso en ar.wikipedia.org
- Uso en ast.wikipedia.org
- Uso en bn.wikipedia.org
- Uso en bxr.wikipedia.org
- Uso en ca.wikipedia.org
- Uso en cs.wikipedia.org
- Uso en de.wikipedia.org
- Uso en el.wikipedia.org
- Uso en en.wikipedia.org
- West Antarctic Ice Sheet
- Portal:Maps/Maps/Geographic
- Tipping points in the climate system
- Portal:Maps/Maps/Geographic/11
- Wikipedia:ITN archives/2009/February
- Wikipedia:Graphics Lab/Map workshop/Archive/Apr 2014
- Wikipedia:Reference desk/Archives/Science/2016 July 19
- User:JPxG/Coolpix
- User:JPxG/!
- User:HN016AQ/sandbox
- Uso en et.wikipedia.org
- Uso en fr.wikipedia.org
- Uso en fr.wikinews.org
- Uso en gl.wikipedia.org
- Uso en id.wikipedia.org
- Uso en it.wikipedia.org
- Uso en ja.wikipedia.org
- Uso en ka.wikipedia.org
- Uso en kn.wikipedia.org
- Uso en la.wikipedia.org
- Uso en mk.wikipedia.org
- Uso en mn.wikipedia.org
- Uso en nl.wikipedia.org
- Uso en nn.wikipedia.org
- Uso en pl.wikipedia.org
- Uso en pnb.wikipedia.org
- Uso en pt.wikipedia.org
- Uso en sl.wikipedia.org
- Uso en sr.wikipedia.org
- Uso en tr.wikipedia.org
Ver más uso global de este archivo.