Archivo:Butterworth response.svg
Ver la imagen en su resolución original((Imagen SVG, nominalmente 512 × 384 pixels, tamaño de archivo: 41 kB))

Resumen

Descripción
English: This is the SVG version of the PNG image created by Omegatron.

I simply changed the terminal type from PostScript to SVG in the gnuplot script file.

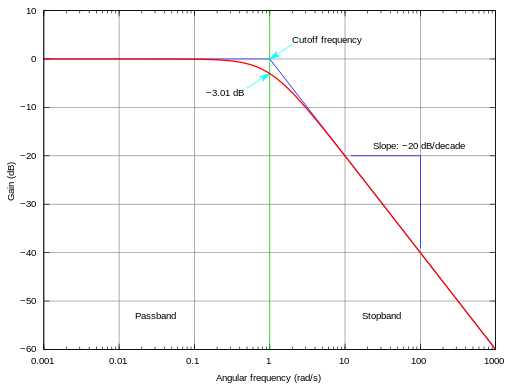
The frequency response of a Butterworth filter with logarithmic axes (Bode plot) and various labels. Cutoff frequency is normalized to 1 rad/s. Gain is normalized to 0 dB in the passband.

Esta es una imagen retocada, lo que significa que ha sido alterada digitalmente de su versión original. Modificaciones: Converted to vector graphics. La original se puede ver aquí: Butterworth response.png. Las modificaciones las hizo Krishnavedala.

Traduce este archivo.

Este archivo SVG contiene texto incrustado que puede traducirse a su lengua, mediante un editor que admita SVG (como XML o texto). Para más información, véase: Sobre la traducción de archivos SVG.

 
Este gráfico vectorial, sin especificar según el W3C, fue creado con Gnuplot.
Fecha (UTC)
Fuente
Autor
Otras versiones
gnuplot source
InfoField
click to expand
set samples 2001
# set terminal postscript enhanced landscape color lw 2 "Times-Roman" 20
set terminal svg size 800 600 dynamic enhanced
set output "butterworth.svg"

# Butterworth amplitude response and decibel calculation.  n is the order, which is just 1 in this image.
G(w,n) = 1 / (sqrt(1 + w**(2*n)))
dB(x) = 20 * log10(abs(x))

# Gridlines
set grid

# Set x axis to logarithmic scale
set logscale x 10

# Set range of x and y axes
set xrange [0.001:1000]
set yrange [-60:10]

# Create x-axis tic marks once per decade (every multiple of 10)
set xtics 10

# Use 10 x-axis minor divisions per major division
set mxtics 10

# Axis labels
set xlabel "Angular frequency (rad/s)"
set ylabel "Gain (dB)"

# No need for a key
set nokey #0.1,-25

# Frequency response's line plotting style
set style line 1 lt 1 lw 2

# Draw a separator between passband and stopband and label them
set style line 2 lt 2 lw 1 
set style arrow 2 nohead ls 2
set arrow 3 from 1,-60 to 1,10 as 2

# Label coordinates are relative to the graph window, not to the function, centered at the 1/4 and 3/4 width points
set label 1 "Passband" at graph 0.25, graph 0.1 c
set label 2 "Stopband" at graph 0.75, graph 0.1 c

# Asymptote lines and slope lines are the same "arrow" style
set style line 3 lt 3 lw 1
set style arrow 3 nohead ls 3

# Draw asymptote lines
set arrow 1 from 1,0 to 1000,-60 as 3
set arrow 2 from .001,0 to 1,0 as 3

# -3 dB arrow style and arrow
set style line 4 lt 4 lw 1
set style arrow 4 head filled size screen 0.02,15,45 ls 4
set arrow 4 from 2,3 to 1,0 as 4

# "Cutoff frequency" label uses same coordinates as the function
set label 3 "Cutoff frequency" at 2,4 l

# "-3 dB" label
set arrow 5 from 0.5,-6 to 1,-3 as 4   
set label 4 "-3.01 dB" at 0.5,-7 r

# Draw slope lines and label
set arrow 6 from 100,-20 to 12,-20 as 3
set arrow 7 from 100,-20 to 100,-39 as 3
set label 5 "Slope: -20 dB/decade" at 100,-18 c

# Plot the filter response
plot 
     dB(G(x,1)) ls 1  title "1st-order response"

unset output      # cleanup the handle

Licencia

Yo, titular de los derechos de autor de esta obra, la publico en los términos de las siguientes licencias:
w:es:Creative Commons
atribución compartir igual
Este archivo se encuentra bajo la licencia Creative Commons Attribution-Share Alike 3.0 Unported, 2.5 Generic, 2.0 Generic and 1.0 Generic
Eres libre:
  • de compartir – de copiar, distribuir y transmitir el trabajo
  • de remezclar – de adaptar el trabajo
Bajo las siguientes condiciones:
  • atribución – Debes otorgar el crédito correspondiente, proporcionar un enlace a la licencia e indicar si realizaste algún cambio. Puedes hacerlo de cualquier manera razonable pero no de manera que sugiera que el licenciante te respalda a ti o al uso que hagas del trabajo.
  • compartir igual – En caso de mezclar, transformar o modificar este trabajo, deberás distribuir el trabajo resultante bajo la misma licencia o una compatible como el original.
GNU head Se autoriza la copia, distribución y modificación de este documento bajo los términos de la licencia de documentación libre GNU, versión 1.2 o cualquier otra que posteriormente publique la Fundación para el Software Libre; sin secciones invariables, textos de portada, ni textos de contraportada. Se incluye una copia de la dicha licencia en la sección titulada Licencia de Documentación Libre GNU.
Puedes usar la licencia que prefieras.

Registro original de carga

This image is a derivative work of the following images:

  • Image:Butterworth_response.png licensed with Cc-by-sa-3.0,2.5,2.0,1.0, GFDL
    • 2005-07-23T17:45:55Z Omegatron 1240x880 (87607 Bytes) split the cutoff frequency markers
    • 2005-07-23T16:31:54Z Omegatron 1250x880 (94570 Bytes) Better butterworth filter response curve
    • 2005-06-26T19:54:33Z Omegatron 250x220 (2251 Bytes) A graph or diagram made by [[User:Omegatron]]. (Uploaded with Wikimedia Commons.) Source: Created by [[User:Omegatron]] {{GFDL}}{{cc-by-sa-2.0}} [[Category:Diagrams]]\

Uploaded with derivativeFX

Leyendas

Añade una explicación corta acerca de lo que representa este archivo

Elementos representados en este archivo

representa a

image/svg+xml

09460ebc1e3325b1d79e3f2cf9a6024d339a6aad

384 píxel

512 píxel

Historial del archivo

Haz clic sobre una fecha y hora para ver el archivo tal como apareció en ese momento.

Fecha y horaMiniaturaDimensionesUsuarioComentario
actual09:50 25 abr 2013Miniatura de la versión del 09:50 25 abr 2013512 × 384 (41 kB)Incnis Mrsidehyphenation
23:17 4 jul 2008Miniatura de la versión del 23:17 4 jul 2008512 × 384 (41 kB)Krishnavedala{{Information |Description=This is the en:SVG version of the en:PNG image created by en:User:Omegatron. I simply changed the terminal type from en:postscript to SVG in the en:GNUplot script file. The [[w:frequency response|frequency

Las siguientes páginas usan este archivo:

Uso global del archivo

Las wikis siguientes utilizan este archivo:

Metadatos