Archivo:Journal.pone.0001596.g004.png
Tamaño de esta previsualización: 361 × 598 píxeles. Otras resoluciones: 145 × 240 píxeles · 289 × 480 píxeles · 996 × 1651 píxeles.
Ver la imagen en su resolución original (996 × 1651 píxeles; tamaño de archivo: 953 kB; tipo MIME: image/png)
| Descripción |
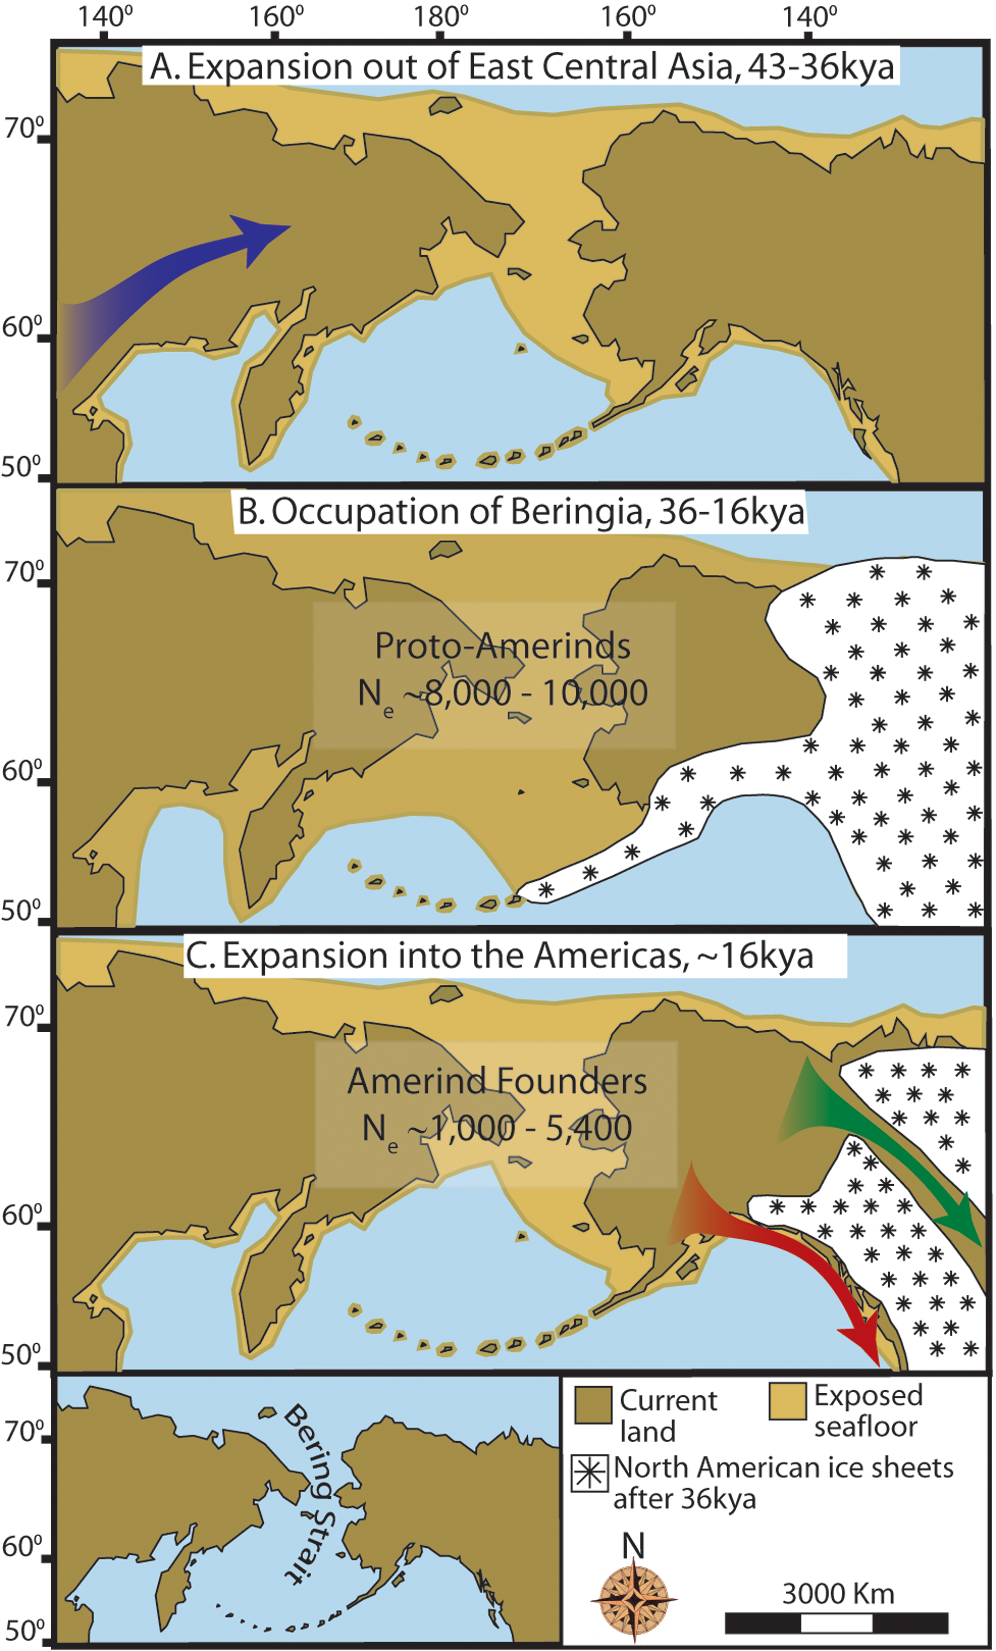
English: Maps depicting each phase of our three-step colonization model for the peopling of the Americas. (A) Divergence, then gradual population expansion of the Amerind ancestors from their East Central Asian gene pool (blue arrow). (B) Proto-Amerind occupation of Beringia with little to no population growth for ~20,000 years. (C) Rapid colonization of the New World by a founder group migrating southward through the ice free, inland corridor between the eastern Laurentide and western Cordilleran Ice Sheets (green arrow) and/or along the Pacific coast (red arrow). In (B), the exposed seafloor is shown at its greatest extent during the last glacial maximum at ~20–18 kya [25]. In (A) and (C), the exposed seafloor is depicted at ~40 kya and ~16 kya, when prehistoric sea levels were comparable [24], [25]. Because of the earth's curvature, the km scale (which is based on the straight line distance at the equator) provides only an approximation of the same distance between two points on these maps. In addition, a scaled-down version of Beringia today (60% reduction of A–C) is presented in the lower left corner. This smaller map highlights the Bering Strait that has geographically separated the New World from Asia since ~11–10 kya. |
| Fecha | 5 October 2009, 05:29 |
| Fuente | doi:10.1371/journal.pone.0001596.g004 |
| Autor | Buzzzsherman |
| Permiso (Reutilización de este archivo) |
Este archivo se encuentra bajo la licencia Creative Commons Genérica de Atribución/Compartir-Igual 3.0.
|
Historial del archivo
Haz clic sobre una fecha y hora para ver el archivo tal como apareció en ese momento.
| Fecha y hora | Miniatura | Dimensiones | Usuario | Comentario | |
|---|---|---|---|---|---|
| actual | 17:26 18 ene 2015 | | 996 × 1651 (953 kB) | Kopiersperre | high-res |
| 17:37 5 nov 2009 |  | 361 × 598 (191 kB) | Merikanto~commonswiki | {{Information |Description=Maps depicting each phase of our three-step colonization model for the peopling of the Americas. '''(A) Divergence, then gradual population expansion of the Amerind ancestors from their East Central Asian gene pool (blue arrow). |
Usos del archivo
La siguiente página usa este archivo:
Uso global del archivo
Las wikis siguientes utilizan este archivo:
- Uso en ast.wikipedia.org
- Uso en ca.wikipedia.org
- Uso en de.wikipedia.org
- Uso en en.wikipedia.org
- Uso en eu.wikipedia.org
- Uso en fi.wikipedia.org
- Uso en fr.wikipedia.org
- Uso en he.wikipedia.org
- Uso en hi.wikipedia.org
- Uso en hy.wikipedia.org
- Uso en it.wikipedia.org
- Uso en ko.wikipedia.org
- Uso en lfn.wikipedia.org
- Uso en pl.wikipedia.org
- Uso en pt.wikipedia.org
- Uso en ru.wikipedia.org
- Uso en zh.wikipedia.org