Archivo:Temperature reconstruction last two millennia.svg

Ver la imagen en su resolución original ((Imagen SVG, nominalmente 485 × 325 pixels, tamaño de archivo: 134 kB))
Resumen

|
Este archivo SVG contiene texto incrustado que puede traducirse a su lengua, mediante un editor que admita SVG (como XML o texto). Para más información, véase: Sobre la traducción de archivos SVG. |
| Descripción |
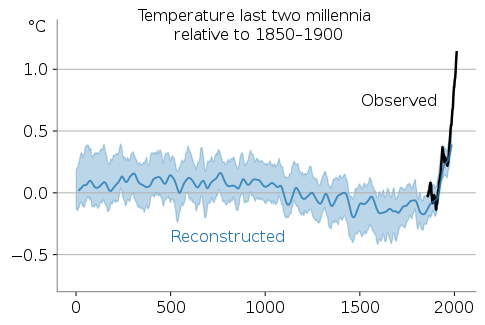
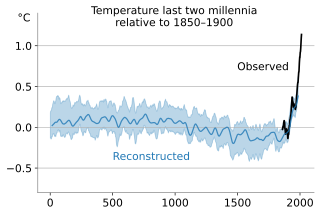
English: Temperatures with respect to the 1850–1900 mean over the last 2 millennia (blue) and observational estimates ranging from 1850 to 2020 (black). The shaded region contains the 68% confidence interval. The temperature anomalies are from the 2019 Nature Geoscience paper by the Pages2k Consortium.[1] using a wide set of proxies that have been vetted by the same consortium.[2] They include tree ring data, data from corals and ice core data.
The confidence interval incorporates two sources of uncertainty. The first one derives from the the method of translating information in the proxies into temperatures. Seven different peer-reviewed methods are employed and all considered equally likely in the figure. The methods range from a simple linear method where proxies sensitivities are fitted to the observational to determine past temperature, to more complicated methods in which information about spatial patterns is taken into account, or information about natural forcing is taken into account. The second type of uncertainty is in the selection of proxies. Some proxies might not be entirely reliable and their inclusion might slightly bias the reconstruction. By randomly selecting a subset of proxies, this uncertainty can be quantified. Code to create the figure is adapted from the Nature Geosciences paper[1] and can be found on https://figshare.com/collections/Global_mean_temperature_reconstructions_over_the_Common_Era/4507043. The figure is a simplification of Fig 1a from this paper. Individual reconstruction methods are not shown. The observational data is HadCRUT5, plotted with a ten-year running mean.[3] references
|
| Fecha | |
| Fuente | Trabajo propio |
| Autor | Femke Nijsse |
| Otras versiones |
The above two-millennia chart is included in the following composites:
Obras derivadas de ésta: |


Licencia
- Eres libre:
- de compartir – de copiar, distribuir y transmitir el trabajo
- de remezclar – de adaptar el trabajo
- Bajo las siguientes condiciones:
- atribución – Debes otorgar el crédito correspondiente, proporcionar un enlace a la licencia e indicar si realizaste algún cambio. Puedes hacerlo de cualquier manera razonable pero no de manera que sugiera que el licenciante te respalda a ti o al uso que hagas del trabajo.
- compartir igual – En caso de mezclar, transformar o modificar este trabajo, deberás distribuir el trabajo resultante bajo la misma licencia o una compatible como el original.
Historial del archivo
Haz clic sobre una fecha y hora para ver el archivo tal como apareció en ese momento.
| Fecha y hora | Miniatura | Dimensiones | Usuario | Comentario | |
|---|---|---|---|---|---|
| actual | 17:37 3 abr 2023 | | 485 × 325 (134 kB) | Aspere | File uploaded using svgtranslate tool (https://svgtranslate.toolforge.org/). Added translation for ko. |
| 10:18 10 sep 2022 |  | 485 × 325 (133 kB) | Theklan | File uploaded using svgtranslate tool (https://svgtranslate.toolforge.org/). Added translation for eu. | |
| 04:13 9 ene 2022 |  | 485 × 325 (132 kB) | TAKAHASHI Shuuji | File uploaded using svgtranslate tool (https://svgtranslate.toolforge.org/). Added translation for ja. | |
| 11:51 17 dic 2021 |  | 485 × 325 (131 kB) | Gabriel Kielland | File uploaded using svgtranslate tool (https://svgtranslate.toolforge.org/). Added translation for nb. | |
| 22:05 14 dic 2021 |  | 485 × 325 (128 kB) | RCraig09 | 14 Dec 2021: per Talk page, nudging "Observed" to the right and anchoring at end of text so long-word translations will expand from right to left and not intersect the graph trace. | |
| 19:47 7 dic 2021 |  | 485 × 325 (128 kB) | Chidgk1 | File uploaded using svgtranslate tool (https://svgtranslate.toolforge.org/). Added translation for tr. | |
| 15:19 7 dic 2021 |  | 485 × 325 (124 kB) | GoEThe | File uploaded using svgtranslate tool (https://svgtranslate.toolforge.org/). Added translation for pt. | |
| 16:44 3 dic 2021 |  | 485 × 325 (121 kB) | Femke | File uploaded using svgtranslate tool (https://svgtranslate.toolforge.org/). Added translation for nl. | |
| 16:42 3 dic 2021 |  | 485 × 325 (121 kB) | Femke | File uploaded using svgtranslate tool (https://svgtranslate.toolforge.org/). Added translation for es. | |
| 16:33 3 dic 2021 |  | 485 × 325 (122 kB) | Femke | Allow more space for translations |
Usos del archivo
Las siguientes páginas usan este archivo:
Uso global del archivo
Las wikis siguientes utilizan este archivo:
- Uso en af.wikipedia.org
- Uso en ar.wikipedia.org
- Uso en ast.wikipedia.org
- Uso en ba.wikipedia.org
- Uso en bg.wikipedia.org
- Uso en bh.wikipedia.org
- Uso en ca.wikipedia.org
- Uso en en.wikipedia.org
- Uso en en.wikibooks.org
- Uso en eo.wikipedia.org
- Uso en eu.wikipedia.org
- Uso en fi.wikipedia.org
- Uso en fr.wikipedia.org
- Uso en gl.wikipedia.org
- Uso en gu.wikipedia.org
- Uso en he.wikipedia.org
- Uso en hi.wikipedia.org
- Uso en hu.wikipedia.org
- Uso en ilo.wikipedia.org
- Uso en it.wikipedia.org
- Uso en kn.wikipedia.org
- Uso en ko.wikipedia.org
- Uso en la.wikipedia.org
- Uso en lt.wikipedia.org
- Uso en nl.wikipedia.org
- Uso en no.wikipedia.org
- Uso en pl.wikipedia.org
- Uso en pt.wikipedia.org
Ver más uso global de este archivo.