Archivo:Timeline of daily COVID-19 vaccine doses administered in the US.svg

Tamaño de esta previsualización PNG del archivo SVG: 800 × 565 píxeles. Otras resoluciones: 320 × 226 píxeles · 640 × 452 píxeles · 1024 × 723 píxeles · 1280 × 904 píxeles · 2560 × 1807 píxeles.
Ver la imagen en su resolución original ((Imagen SVG, nominalmente 850 × 600 pixels, tamaño de archivo: 57 kB))
Resumen
| Descripción |
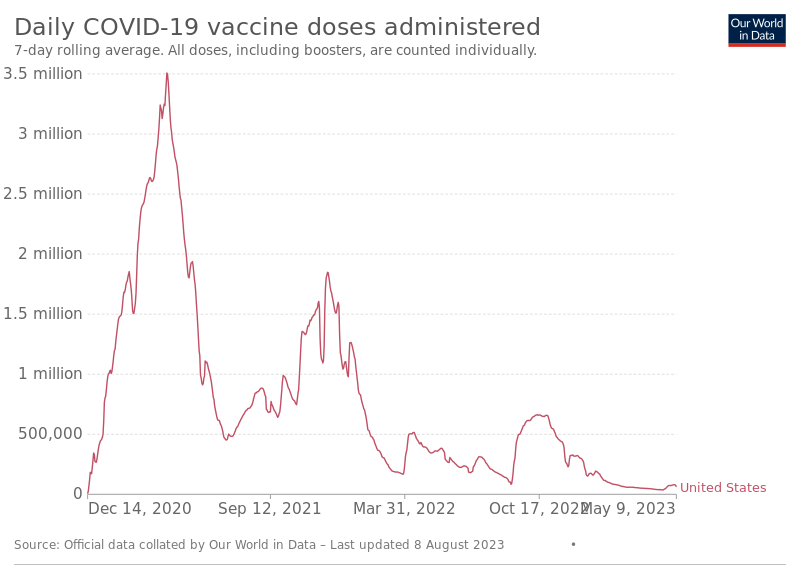
English: Timeline of daily COVID-19 vaccine doses administered in the US. Rolling 7-day average. See the date on the right side of the timeline below the graph. |
| Fecha | 20 de junio de 2021 is the date of the first upload to the Commons. See the file history below for the most recent upload date. Please upload new versions. Use the upload link at the end of the file history list. |
| Fuente | https://ourworldindata.org/grapher/daily-covid-19-vaccination-doses?tab=chart&country=~USA Click on the download tab, and then the SVG link to get the SVG file. The table tab has a table of the data by date. The sources tab says the data is from the COVID-19 Data Repository by the Center for Systems Science and Engineering (CSSE) at Johns Hopkins University. The graph on the chart tab at the source is interactive and provides more detail. For example, run your cursor over the graph to see the date and the number vaccinated that day. The actual number may be higher or lower since a rolling 7-day average is used. |
| Autor | Our World In Data. See Our World in Data. |
| SVG desarrollo | El código fuente de esta imagen SVG es inválido por un error. Este gráfico vectorial, inválido según el W3C, fue creado con una desconocida SVG herramienta |
Licencia
Este archivo está disponible bajo la licencia Creative Commons Atribución 4.0 Internacional.
- Eres libre:
- de compartir – de copiar, distribuir y transmitir el trabajo
- de remezclar – de adaptar el trabajo
- Bajo las siguientes condiciones:
- atribución – Debes otorgar el crédito correspondiente, proporcionar un enlace a la licencia e indicar si realizaste algún cambio. Puedes hacerlo de cualquier manera razonable pero no de manera que sugiera que el licenciante te respalda a ti o al uso que hagas del trabajo.
Historial del archivo
Haz clic sobre una fecha y hora para ver el archivo tal como apareció en ese momento.
| Fecha y hora | Miniatura | Dimensiones | Usuario | Comentario | |
|---|---|---|---|---|---|
| actual | 18:52 8 ago 2023 | | 850 × 600 (57 kB) | Timeshifter | Latest |
| 23:44 19 may 2023 |  | 850 × 600 (57 kB) | Timeshifter | Latest | |
| 15:39 12 dic 2022 |  | 850 × 600 (51 kB) | Timeshifter | latest graph from source. | |
| 10:26 23 oct 2022 |  | 850 × 600 (49 kB) | Timeshifter | latest graph from source. | |
| 04:00 13 jun 2022 |  | 850 × 600 (44 kB) | Timeshifter | latest graph from source. | |
| 10:53 30 may 2022 |  | 850 × 600 (44 kB) | Timeshifter | Latest graph from source. | |
| 18:19 7 may 2022 |  | 850 × 600 (43 kB) | Timeshifter | latest graph from source. | |
| 13:12 27 mar 2022 |  | 850 × 600 (69 kB) | Junior Jumper | c:User:Rillke/bigChunkedUpload.js: Latest graph from source. | |
| 11:14 1 mar 2022 |  | 850 × 600 (67 kB) | Timeshifter | Latest graph from source. | |
| 03:10 23 feb 2022 |  | 850 × 600 (66 kB) | Timeshifter | Latest graph from source. |
Usos del archivo
Las siguientes páginas usan este archivo:
Uso global del archivo
Las wikis siguientes utilizan este archivo: