Archivo:WeierstrassFunction.svg

Tamaño de esta previsualización PNG del archivo SVG: 795 × 505 píxeles. Otras resoluciones: 320 × 203 píxeles · 640 × 407 píxeles · 1024 × 650 píxeles · 1280 × 813 píxeles · 2560 × 1626 píxeles.
Ver la imagen en su resolución original ((Imagen SVG, nominalmente 795 × 505 pixels, tamaño de archivo: 120 kB))
Resumen
| Descripción |
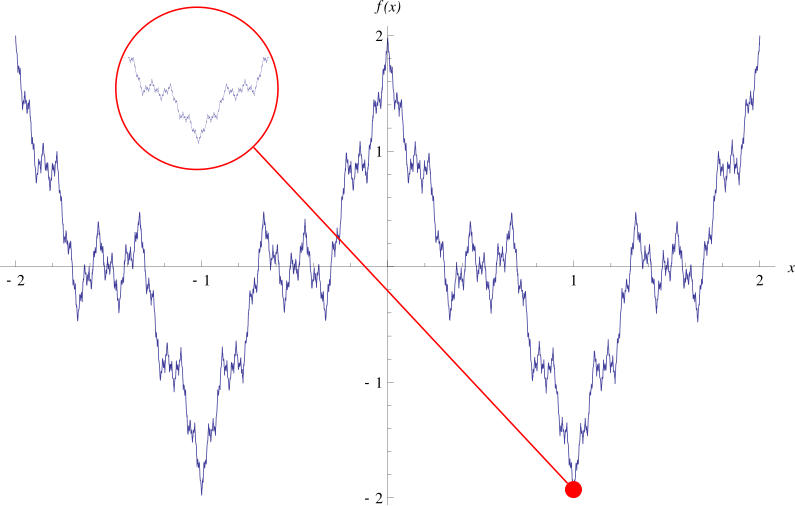
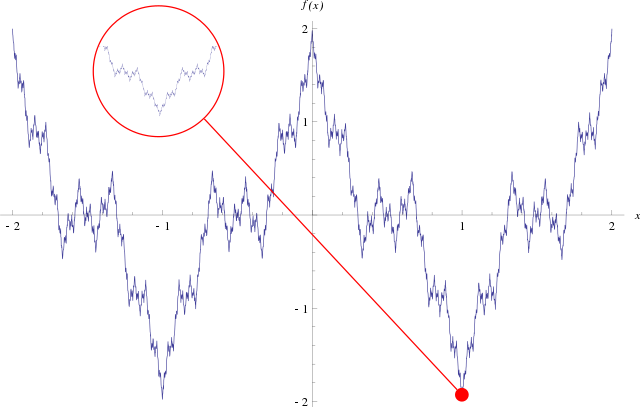
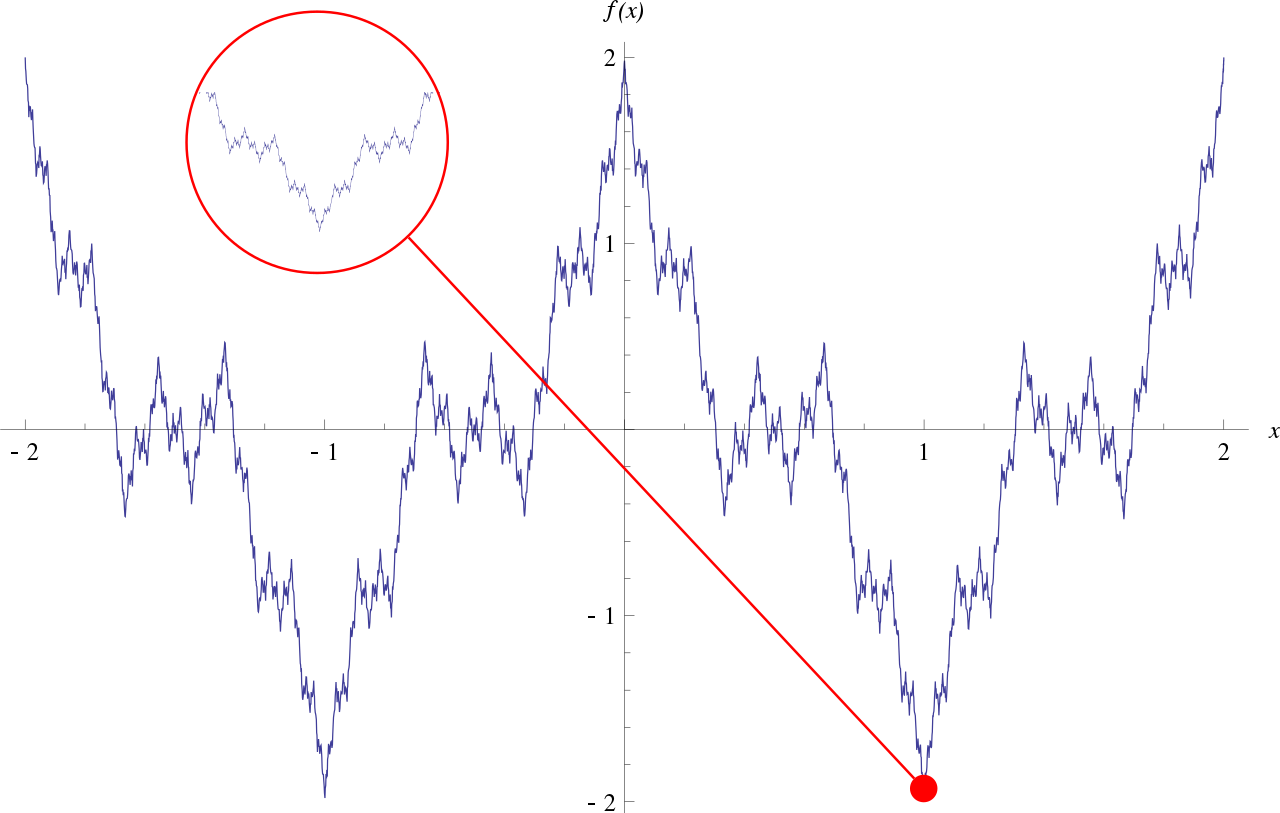
English: Plot of the Weierstrass function. A section of the plot is zoomed in on to illustrate the fractal nature of the function. The plot was generated using Mathematica and exported to SVG. I first made a plot of the region and then a plot of a much smaller section around the red point on the image. With the use of Inkscape, I was able to put the two in the same SVG file. This file is an Inkscape SVG, not a plain SVG. |
| Fecha | |
| Fuente | Trabajo propio |
| Autor | Eeyore22 |
| Otras versiones | File:Weierstrass_function.gif |
W3C-validity not checked.
Licencia
| Yo, el titular de los derechos de autor de esta obra, lo libero al dominio público. Esto aplica en todo el mundo. En algunos países esto puede no ser legalmente factible; si ello ocurriese: Concedo a cualquier persona el derecho de usar este trabajo para cualquier propósito, sin ningún tipo de condición al menos que éstas sean requeridas por la ley. |
Historial del archivo
Haz clic sobre una fecha y hora para ver el archivo tal como apareció en ese momento.
| Fecha y hora | Miniatura | Dimensiones | Usuario | Comentario | |
|---|---|---|---|---|---|
| actual | 00:44 27 oct 2008 | | 795 × 505 (120 kB) | Eeyore22~commonswiki | {{Information |Description={{en|1=Plot of the Weierstrass function. A section of the plot is zoomed in on to illustrate the fractal nature of the function.}} |Source=Own work by uploader |Author=Eeyore22 |Date=October 26, 2008 |Permissio |
Usos del archivo
Las siguientes páginas usan este archivo:
Uso global del archivo
Las wikis siguientes utilizan este archivo:
- Uso en ar.wikipedia.org
- Uso en bg.wikipedia.org
- Uso en ca.wikipedia.org
- Uso en cs.wikipedia.org
- Uso en cv.wikipedia.org
- Uso en de.wikipedia.org
- Uso en de.wikiversity.org
- Kurs:Mathematik für Anwender (Osnabrück 2011-2012)/Teil I/Vorlesung 15
- Kurs:Mathematik für Anwender (Osnabrück 2011-2012)/Teil I/Vorlesung 15/kontrolle
- Kurs:Analysis (Osnabrück 2013-2015)/Teil I/Vorlesung 12
- Kurs:Analysis (Osnabrück 2014-2016)/Teil I/Vorlesung 12
- Kurs:Analysis (Osnabrück 2014-2016)/Teil I/Vorlesung 12/kontrolle
- Kurs:Grundkurs Mathematik (Osnabrück 2016-2017)/Teil II/Vorlesung 51
- Kurs:Grundkurs Mathematik (Osnabrück 2016-2017)/Teil II/Vorlesung 51/kontrolle
- Kurs:Grundkurs Mathematik (Osnabrück 2018-2019)/Teil II/Vorlesung 51
- Kurs:Grundkurs Mathematik (Osnabrück 2018-2019)/Teil II/Vorlesung 51/kontrolle
- Kurs:Mathematik für Anwender (Osnabrück 2019-2020)/Teil I/Vorlesung 10
- Kurs:Mathematik für Anwender (Osnabrück 2019-2020)/Teil I/Vorlesung 10/kontrolle
- Kurs:Mathematik für Anwender (Osnabrück 2019-2020)/Teil I/Repetitorium/Vorlesung 10
- Kurs:Mathematik für Anwender (Osnabrück 2020-2021)/Teil I/Vorlesung 10
- Kurs:Mathematik für Anwender (Osnabrück 2020-2021)/Teil I/Vorlesung 10/kontrolle
- Kurs:Analysis (Osnabrück 2021-2023)/Teil I/Vorlesung 12
- Stetige Funktion/K/Motivation/Einführung/Textabschnitt
- Kurs:Analysis (Osnabrück 2021-2023)/Teil I/Vorlesung 12/kontrolle
- Kurs:Grundkurs Mathematik (Osnabrück 2022-2023)/Teil II/Vorlesung 51
- Kurs:Grundkurs Mathematik (Osnabrück 2022-2023)/Teil II/Vorlesung 51/kontrolle
- Kurs:Analysis (Osnabrück 2013-2015)/Teil I/Vorlesung 12/kontrolle
- Reelle Zahlen/Stetige Funktionen/Motivation/Einführung/Textabschnitt
- Kurs:Maßtheorie auf topologischen Räumen/Differenzierbarkeit in Analysis und Funktiontheorie
- Reelle Funktionen/Stetig/Einführung/Textabschnitt
- Kurs:Mathematik für Anwender (Osnabrück 2023-2024)/Teil I/Vorlesung 10
- Kurs:Mathematik für Anwender (Osnabrück 2023-2024)/Teil I/Vorlesung 10/kontrolle
- Uso en el.wikipedia.org
- Uso en en.wikipedia.org
- Uso en en.wikibooks.org
- Uso en en.wikiversity.org
- Real numbers/Continuous functions/Motivation/Introduction/Section
- Mathematics for Applied Sciences (Osnabrück 2023-2024)/Part I/Lecture 10
- Mathematics for Applied Sciences (Osnabrück 2023-2024)/Part I/Lecture 10/latex
- Mathematics for Applied Sciences (Osnabrück 2023-2024)/Part I/Lecture 10/refcontrol
- Uso en en.wiktionary.org
- Uso en et.wikipedia.org
- Uso en eu.wikipedia.org
- Uso en fa.wikipedia.org
- Uso en fr.wikipedia.org
- Uso en gl.wikipedia.org
Ver más uso global de este archivo.