Archivo:Major cities threatened by sea level rise.png
Ver la imagen en su resolución original (1425 × 625 píxeles; tamaño de archivo: 29 kB; tipo MIME: image/png)
Resumen
| Descripción |
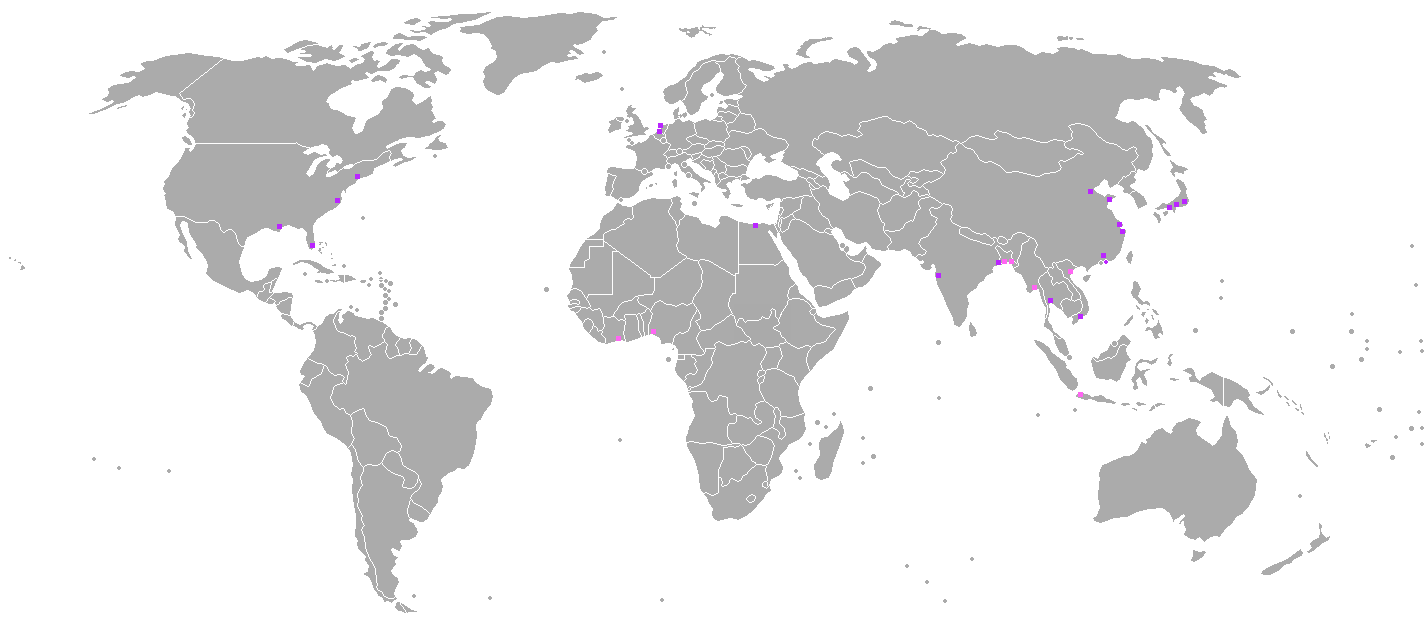
English: Map showing the major cities (in terms of assets and population) that are under threat by the rising sea level. The cities indicated are under threat of even a small sea level rise (of 1.6 foot/49 cm) compared to the level in 2010). Even moderate projections indicate that such a rise will have occured by 2060[1][2]
The map was based on data of a 2007 OECD report[3][4] The report also stated that the total value of the assets exposed in 2005 across all cities is about US$3,000 billion. The top 20 cities in the world in terms of assets exposed to coastal flooding was marked in purple; additional cities that are in the top 20 in terms of population exposed to coastal flooding were marked in pink (there are only 27 cities on the whole map since these cities that have the largest amount of assets exposed to it also have the most people exposed to it). The list of the top 20 cities exposed to coastal flooding is:
The list of 7 additional cities that are in the top 20 most-populous cities exposed to coastal flooding is:
|
| Fecha | |
| Fuente | Trabajo propio |
| Autor | Genetics4good |
Licencia
- Eres libre:
- de compartir – de copiar, distribuir y transmitir el trabajo
- de remezclar – de adaptar el trabajo
- Bajo las siguientes condiciones:
- atribución – Debes otorgar el crédito correspondiente, proporcionar un enlace a la licencia e indicar si realizaste algún cambio. Puedes hacerlo de cualquier manera razonable pero no de manera que sugiera que el licenciante te respalda a ti o al uso que hagas del trabajo.
- compartir igual – En caso de mezclar, transformar o modificar este trabajo, deberás distribuir el trabajo resultante bajo la misma licencia o una compatible como el original.
- ↑ File:Projections of global mean sea level rise by Parris et al. (2012).png
- ↑ Sea level rise chart
- ↑ 2007 OECD report
- ↑ OECD report, shortened version
.png)
Historial del archivo
Haz clic sobre una fecha y hora para ver el archivo tal como apareció en ese momento.
| Fecha y hora | Miniatura | Dimensiones | Usuario | Comentario | |
|---|---|---|---|---|---|
| actual | 23:31 10 ene 2016 | | 1425 × 625 (29 kB) | Magog the Ogre | Reverted to version as of 12:52, 2 November 2013 (UTC) |
| 12:52 2 nov 2013 |  | 1425 × 625 (29 kB) | Genetics4good | User created page with UploadWizard |
Usos del archivo
La siguiente página usa este archivo:
Uso global del archivo
Las wikis siguientes utilizan este archivo:
- Uso en en.wikipedia.org
- Uso en en.wikiquote.org
- Uso en ig.wikipedia.org
- Uso en mk.wikipedia.org
- Uso en zh.wikipedia.org