Archivo:Radar-bright-band.png
No se dispone de una resolución más alta.
Radar-bright-band.png (791 × 449 píxeles; tamaño de archivo: 263 kB; tipo MIME: image/png)
Resumen
| Descripción |
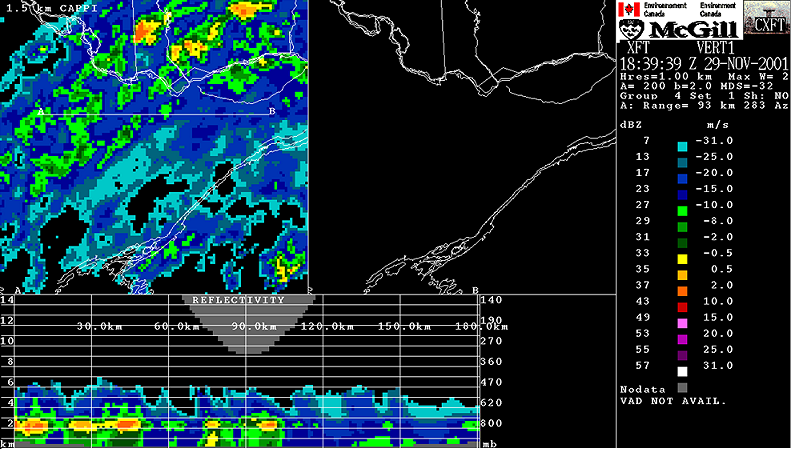
Français : En haut, CAPPI de 1,5km d'altitude montrent de forts échos radar, en jaune, parmi des échos plus faibles en vert. Dans la partie du bas, la coupe verticale à travers les données radar montre que ces intensités sont dues à la présence d'une zone de réflectivité plus intense se situant entre 1,5 km à 2,5 km d'altitude. Cette bande brillante est causée par de la neige fondante.
English: Snow falling through the freezing level will melt and reach the ground as rain. On this image, at the top we can see a CAPPI of precipitations. At the bottom, there is a cross-section of the radar data from ground to 15 km. One can see a level where echos are stronger: the bright-band. The melting begin to occur just above this band and continue until its lower part. This effect is due to the fact that the reflectivity depend on the 6th power of the diameter of targets multiplied by its ability to reflect. Snow flakes are much larger than rain drops but they reflect much less so echos from snow and rain have intensities relatively close. However, when snow melt, it keeps its diameter for a while and get coated with water. The radar beam sees something similar to a very larger water dropplet and the return is producing this very strong band. |
| Fecha | 1839 UTC |
| Fuente |
English: Meteorological Service of Canada (Environment Canada). Redistribution allowed if source mentionned |
| Autor |
Français : Ce radar est opéré par Environnement Canada. La sortie radar est produite par le logiciel développé par l'Observatoire radar J.S. Marshall de l'Université McGill en collaboration avec EC. |
Licencia

|
El titular de los derechos de autor de este archivo permite que cualquiera pueda usarlo para cualquier propósito, siempre que el titular de los derechos de autor sea atribuido apropiadamente. La redistribución, obras derivadas, uso comercial, y todo otro uso está permitido. |
|
|
Historial del archivo
Haz clic sobre una fecha y hora para ver el archivo tal como apareció en ese momento.
| Fecha y hora | Miniatura | Dimensiones | Usuario | Comentario | |
|---|---|---|---|---|---|
| actual | 15:20 8 may 2006 | | 791 × 449 (263 kB) | Pierre cb | Snow falling through the freezing level will melt and reach the ground as rain. On this image, at the top we can see a CAPPI of precipitations. At the bottom, there is a cross-section of the radar data from ground to 15 km. On can see a level where echos |
Usos del archivo
La siguiente página usa este archivo:
Uso global del archivo
Las wikis siguientes utilizan este archivo:
- Uso en en.wikipedia.org
- Uso en fr.wikipedia.org
- Uso en he.wikipedia.org
- Uso en ja.wikipedia.org