Archivo:Timeline of US overdose deaths involving heroin, by other opioid involvement.jpg

Tamaño de esta previsualización: 800 × 600 píxeles. Otras resoluciones: 320 × 240 píxeles · 640 × 480 píxeles · 1024 × 768 píxeles · 1200 × 900 píxeles.
Ver la imagen en su resolución original (1200 × 900 píxeles; tamaño de archivo: 188 kB; tipo MIME: image/jpeg)

|
File:US timeline. Heroin deaths.svg es una versión vectorial de este archivo. Debería usarse esa versión en lugar de este archivo JPG, cuando sea mejor.
File:Timeline of US overdose deaths involving heroin, by other opioid involvement.jpg → File:US timeline. Heroin deaths.svg
Para más información, lee Ayuda:SVG. |
 |
Resumen
| Descripción |
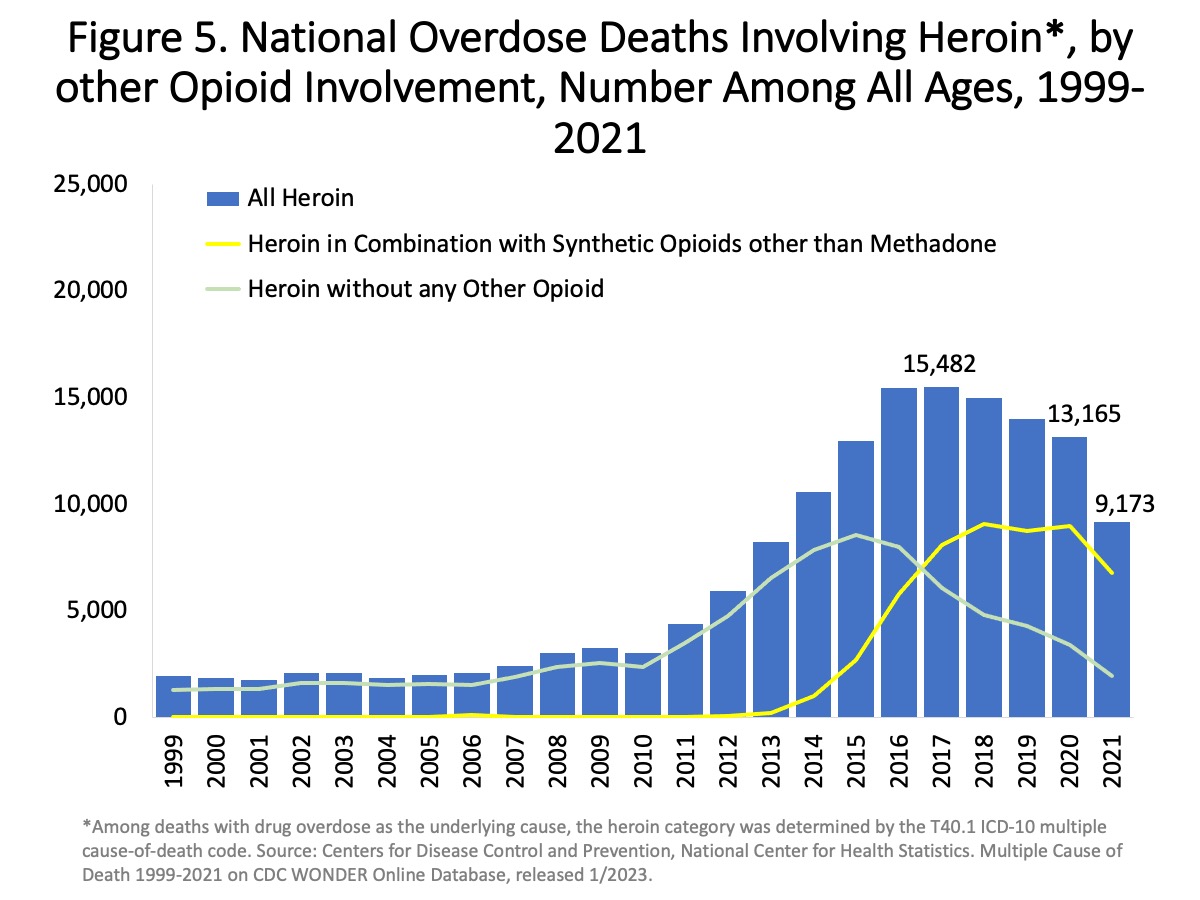
English: "Figure 5. National Overdose Deaths Involving Heroin, by Other Opioid Involvement—Number Among All Ages, 1999-2021. The figure above is a bar and line graph showing the total number of U.S. overdose deaths involving heroin from 1999 to 2021. Drug overdose deaths involving heroin rose from 1,960 in 1999 to 15,482 in 2017 before trending down to 13,165 deaths in 2020 and 9,173 deaths in 2021. The bars are overlaid by lines showing the number of deaths involving heroin in combination with synthetic opioids other than methadone (primarily fentanyl) or without any other opioid from 1999 to 2021 (Source: CDC WONDER)." |
| Fecha | - date of first upload to the Commons. See file history for dates of later uploads. |
| Fuente | Overdose Death Rates. By National Institute on Drug Abuse (NIDA). 1999-2021 chart. 1999-2019 chart. 2002-2017 chart. 2002-2015 chart. 2001-2014 chart. |
| Autor | National Institute on Drug Abuse. Some versions of the chart were cropped, and have had "USA" added to them. Freeware IrfanView, etc. can be used. See Commons:Convert tables and charts to wiki code or image files, and the section about adding text to chart images. |
Licencia
This image is a work of the National Institutes of Health, part of the United States Department of Health and Human Services, taken or made as part of an employee's official duties. As a work of the U.S. federal government, the image is in the public domain.
 |
||
| Esta obra ha sido identificada como libre de las restricciones conocidas en virtud del derecho de autor, incluyendo todos los derechos conexos. | ||
Historial del archivo
Haz clic sobre una fecha y hora para ver el archivo tal como apareció en ese momento.
| Fecha y hora | Miniatura | Dimensiones | Usuario | Comentario | |
|---|---|---|---|---|---|
| actual | 00:00 22 jul 2023 | | 1200 × 900 (188 kB) | Timeshifter | Latest |
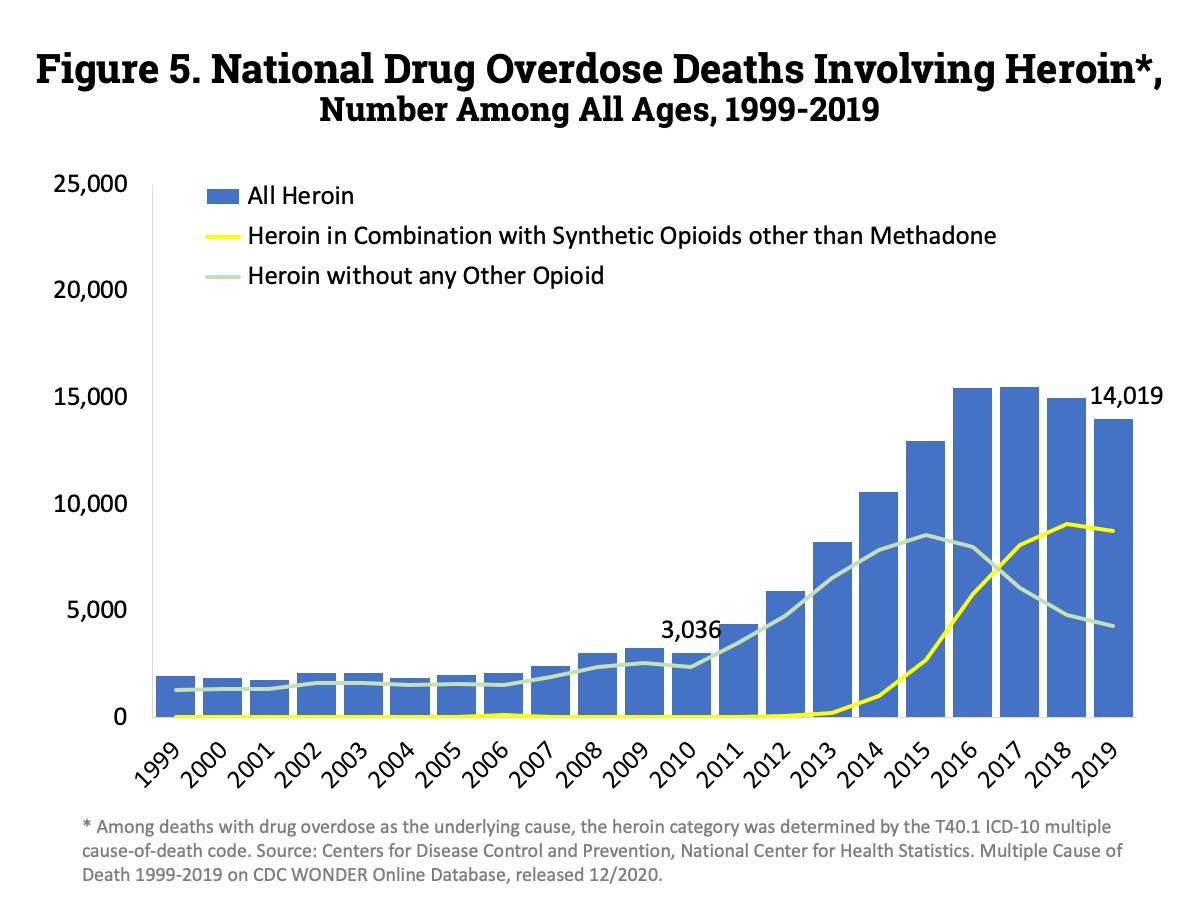
| 08:52 31 ago 2021 |  | 1150 × 865 (184 kB) | Timeshifter | Latest chart from source. | |
| 15:23 6 sep 2018 |  | 810 × 589 (94 kB) | Timeshifter | newer chart | |
| 10:51 27 mar 2017 |  | 794 × 636 (91 kB) | Timeshifter | 2015 column. | |
| 11:11 1 ene 2016 |  | 791 × 586 (84 kB) | Timeshifter | User created page with UploadWizard |
Usos del archivo
La siguiente página usa este archivo:
Uso global del archivo
Las wikis siguientes utilizan este archivo:
- Uso en ar.wikipedia.org
- Uso en en.wikipedia.org
- Uso en hy.wikipedia.org
- Uso en ja.wikipedia.org
- Uso en sr.wikipedia.org
- Uso en vi.wikipedia.org
- Uso en zh.wikipedia.org