Archivo:Evolution of temperature in the Post-Glacial period according to Greenland ice cores.jpg
Tamaño de esta previsualización: 800 × 222 píxeles. Otras resoluciones: 320 × 89 píxeles · 640 × 178 píxeles · 1786 × 496 píxeles.
Ver la imagen en su resolución original (1786 × 496 píxeles; tamaño de archivo: 281 kB; tipo MIME: image/jpeg)
Resumen
| Descripción |
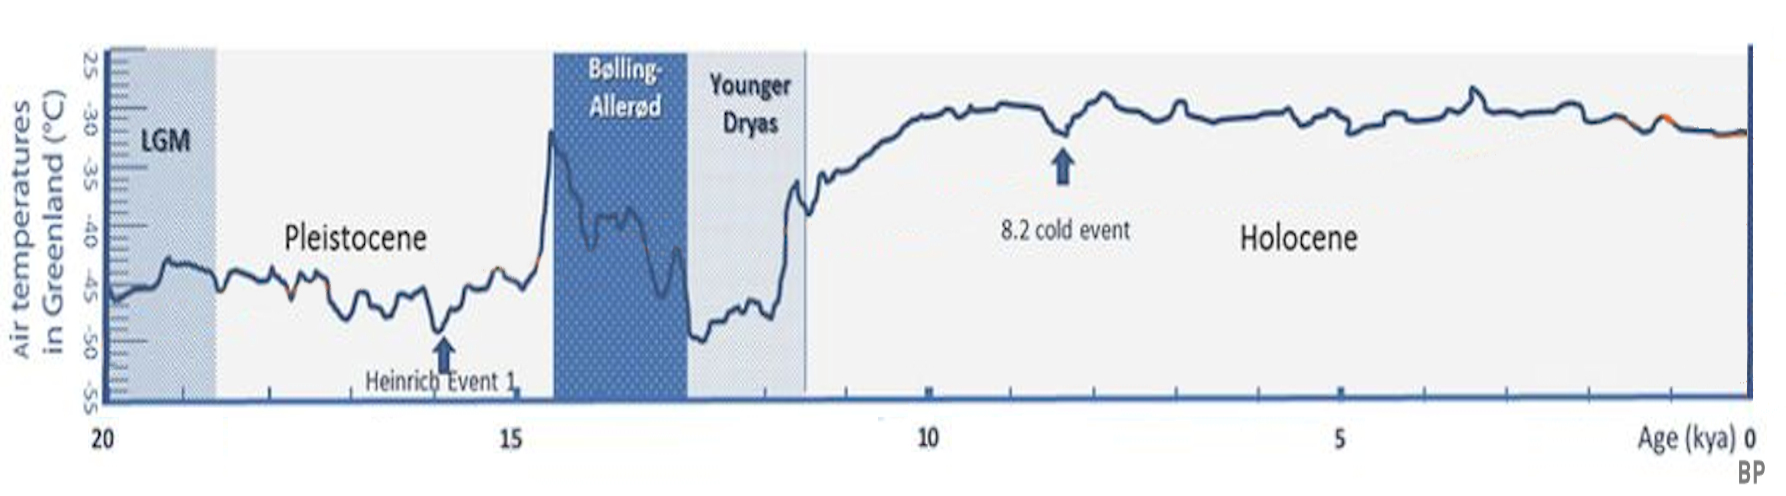
English: Reconstructed air temperatures from the GISP 2 Ice core in Greenland |
||
| Fecha | |||
| Fuente |
Mapping Post-Glacial expansions: The Peopling of Southwest Asia |
||
| Autor | Daniel E. Platt, Marc Haber, Magda Bou Dagher-Kharrat, Bouchra Douaihy, Georges Khazen, Maziar Ashrafian Bonab, Angélique Salloum, Francis Mouzaya, Donata Luiselli, Chris Tyler-Smith, Colin Renfrew, Elizabeth Matisoo-Smith & Pierre A. Zalloua | ||
| Otras versiones |
|


Licencia
Este archivo está disponible bajo la licencia Creative Commons Attribution-Share Alike 4.0 International.
- Eres libre:
- de compartir – de copiar, distribuir y transmitir el trabajo
- de remezclar – de adaptar el trabajo
- Bajo las siguientes condiciones:
- atribución – Debes otorgar el crédito correspondiente, proporcionar un enlace a la licencia e indicar si realizaste algún cambio. Puedes hacerlo de cualquier manera razonable pero no de manera que sugiera que el licenciante te respalda a ti o al uso que hagas del trabajo.
- compartir igual – En caso de mezclar, transformar o modificar este trabajo, deberás distribuir el trabajo resultante bajo la misma licencia o una compatible como el original.
Historial del archivo
Haz clic sobre una fecha y hora para ver el archivo tal como apareció en ese momento.
| Fecha y hora | Miniatura | Dimensiones | Usuario | Comentario | |
|---|---|---|---|---|---|
| actual | 20:41 16 may 2019 | 1786 × 496 (281 kB) | पाटलिपुत्र | better | |
| 11:24 16 may 2019 | 1786 × 372 (238 kB) | पाटलिपुत्र | User created page with UploadWizard |
Usos del archivo
Las siguientes páginas usan este archivo:
Uso global del archivo
Las wikis siguientes utilizan este archivo:
- Uso en af.wikipedia.org
- Uso en ar.wikipedia.org
- Uso en ca.wikipedia.org
- Uso en de.wikipedia.org
- Uso en en.wikipedia.org
- Uso en fr.wikipedia.org
- Uso en he.wikipedia.org
- Uso en id.wikipedia.org
- Uso en ie.wikipedia.org
- Uso en it.wikipedia.org
- Uso en ja.wikipedia.org
- Uso en kk.wikipedia.org
- Uso en lfn.wikipedia.org
- Uso en ms.wikipedia.org
- Uso en ru.wikipedia.org
- Uso en te.wikipedia.org
- Uso en th.wikipedia.org
- Uso en tr.wikipedia.org
- Uso en vi.wikipedia.org
- Uso en zh.wikipedia.org