Archivo:Oil consumption per day by region from 1980 to 2006.svg

Tamaño de esta previsualización PNG del archivo SVG: 600 × 450 píxeles. Otras resoluciones: 320 × 240 píxeles · 640 × 480 píxeles · 1024 × 768 píxeles · 1280 × 960 píxeles · 2560 × 1920 píxeles.
Ver la imagen en su resolución original ((Imagen SVG, nominalmente 600 × 450 pixels, tamaño de archivo: 204 kB))
| Descripción |
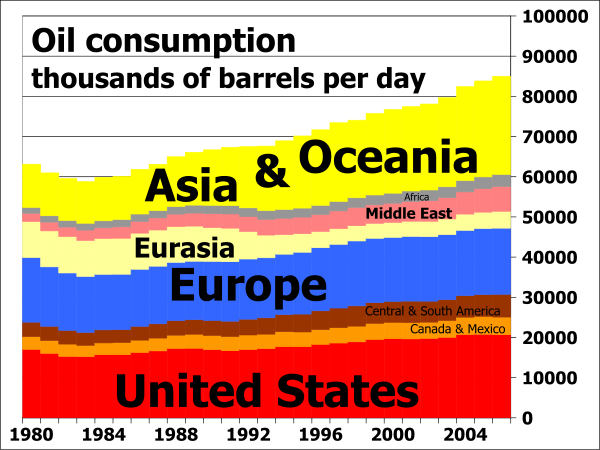
English: Oil consumption in daily barrels per region from 1980 to 2006; vertical extents indicate barrels of oil consumed per day, and the horizontal scale shows years from 1980 to 2007. |
| Fecha | |
| Fuente |
I, 84user, created this work using the excel file RecentPetroleumConsumptionBarrelsperDay.xls from the U.S. Energy Information Administration's web page http://tonto.eia.doe.gov/dnav/pet/pet_pri_wco_k_w.htm (direct link: http://www.eia.doe.gov/emeu/international/RecentPetroleumConsumptionBarrelsperDay.xls) and using Open Source Gnumeric 1.9.1 to produce the chart. See also  |
| Autor | 84user |
| Permiso (Reutilización de este archivo) |
PD-SELF; Released into the public domain (by the author). |
| Otras versiones |
 |
See also


Licencia
| Este trabajo ha sido liberado al dominio público por su autor, 84user. Esto aplica para todo el mundo. En algunos países esto puede no ser legalmente factible; si ello ocurriese: |
Historial del archivo
Haz clic sobre una fecha y hora para ver el archivo tal como apareció en ese momento.
| Fecha y hora | Miniatura | Dimensiones | Usuario | Comentario | |
|---|---|---|---|---|---|
| actual | 14:52 25 oct 2008 | | 600 × 450 (204 kB) | 84user | increased main title font size |
| 14:31 25 oct 2008 |  | 600 × 450 (195 kB) | 84user | {{Information |Description={{en|Oil consumption in daily barrels per region from 1980 to 2006; vertical extents indicate barrels of oil consumed per day, and the horizontal scale shows years from 1980 to 2007.}} |Source=I, 84user, created this work using |
Usos del archivo
La siguiente página usa este archivo:
Uso global del archivo
Las wikis siguientes utilizan este archivo:
- Uso en en.wikipedia.org
- Uso en fa.wikipedia.org
- Uso en id.wikipedia.org
- Uso en ko.wikipedia.org
- Uso en th.wikipedia.org
- Uso en ur.wikipedia.org