Archivo:Spectral leakage caused by "windowing".svg

Tamaño de esta previsualización PNG del archivo SVG: 800 × 492 píxeles. Otras resoluciones: 320 × 197 píxeles · 640 × 393 píxeles · 1024 × 630 píxeles · 1280 × 787 píxeles · 2560 × 1574 píxeles · 1080 × 664 píxeles.
Ver la imagen en su resolución original ((Imagen SVG, nominalmente 1080 × 664 pixels, tamaño de archivo: 170 kB))
Resumen
| Descripción |
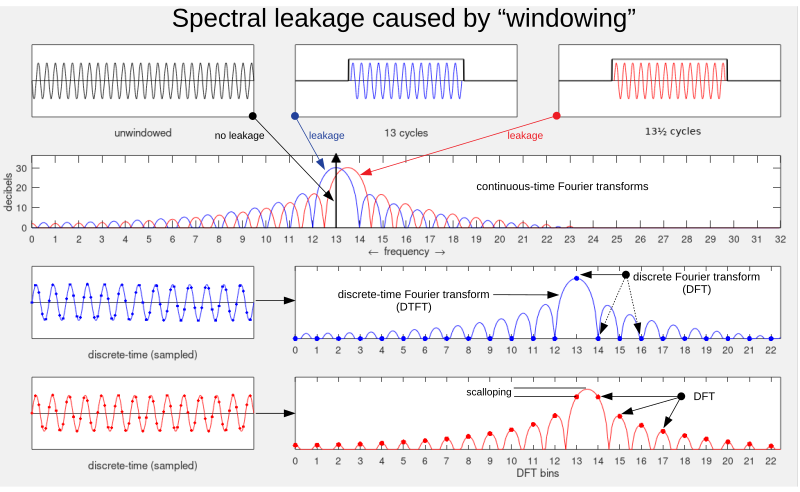
English: The purpose of this image is to show that windowing a sinusoid causes spectral leakage, even if the sinusoid has an integer number of cycles within a rectangular window. The leakage is evident in the 2nd row, blue trace. It is the same amount as the red trace, which represents a slightly higher frequency that does not have an integer number of cycles. When the sinusoid is sampled and windowed, its discrete-time Fourier transform also suffers from the same leakage pattern. But when the DTFT is only sampled, at a certain interval, it is possible (depending on your point of view) to: (1) avoid the leakage, or (2) create the illusion of no leakage. For the case of the blue sinusoid (3rd row of plots, right-hand side), those samples are the outputs of the discrete Fourier transform (DFT). The red sinusoid DTFT (4th row) has the same interval of zero-crossings, but the DFT samples fall in-between them, and the leakage is revealed. |
|||
| Fecha | ||||
| Fuente | Trabajo propio | |||
| Autor | Bob K | |||
| Permiso (Reutilización de este archivo) |
Yo, el titular de los derechos de autor de esta obra, la publico en los términos de la siguiente licencia:
|
|||
| Otras versiones | File:Spectral_leakage_from_a_sinusoid_and_rectangular_window.png | |||
| SVG desarrollo | ||||
| Octave/gnuplot source | click to expand
This graphic was created with the help of the following Octave script: pkg load signal
% Options
frame_background_gray = true;
if frame_background_gray
graphics_toolkit("qt") % or graphics_toolkit("fltk")
frame_background = .94*[1 1 1];
d = 4; % amount to add to text sizes
ds = 8; % amount to small marker size
dl = 12; % amount to large marker size
else
graphics_toolkit("gnuplot") % background will be white regardless of value below
frame_background = .94*[1 1 1];
d=0; ds = 0;; dl = 0
endif
% (https://octave.org/doc/v4.2.1/Graphics-Object-Properties.html#Graphics-Object-Properties)
% Speed things up when using Gnuplot
set(0, "DefaultAxesFontsize",10+d)
set(0, "DefaultTextFontsize",12+d)
set(0, "DefaultAxesYlim",[-2 2])
set(0, "DefaultAxesYtick",[])
set(0, "DefaultAxesXtick",[])
set(0, "DefaultFigureColor",frame_background)
set(0, "DefaultAxesColor","white")
%=======================================================
samples_per_DFT = 64;
DFT_display_bins = samples_per_DFT/2;
samples_per_DTFT = 1024;
Hz_per_bin = 1; % Set the DFT bin spacing to 1 Hz
samples_per_sec = Hz_per_bin*samples_per_DFT; % corresponding sample rate
I = 8; % over-sample the display version of sinusoids
cycles_per_DFT = 13;
cycles_per_sample = cycles_per_DFT/(I*samples_per_DFT);
signal1I = sin(2*pi*cycles_per_sample*(-32*I:96*I)); % pad the [0,64] window with ±32
window1 = signal1I(32*I + (1:samples_per_DFT*I+1)); % extract the window
signal1 = window1(1:I:samples_per_DFT*I); % decimate the over-sample rate
cycles_per_DFT = 13.50; % repeat steps for higher frequency
cycles_per_sample = cycles_per_DFT/(I*samples_per_DFT);
signal2I = sin(2*pi*cycles_per_sample*(-32*I:96*I));
window2 = signal2I(32*I + (1:samples_per_DFT*I+1));
signal2 = window2(1:I:samples_per_DFT*I);
filter = zeros(1,length(signal1I)); % depict a rectangular window
skirt = 10;
filter(32*I + (-skirt+1:samples_per_DFT*I+skirt)) = 1.2;
%=======================================================
hfig = figure("position",[1 -89 1200 800], "color",frame_background);
x1 = .08; % left margin for annotation
x2 = .02; % right margin
ws = .05; % whitespace between plots
y1 = .08 % bottom margin
y2 = .08 % top margin
dy = .08; % vertical space between rows
height = (1-y1-y2-3*dy)/4; % space allocated for each of 4 rows
% Compute width of sinusoid plots
xwhite = x1 + ws + ws + x2; % total whitespace in row containing 3 plots
width1 = (1-xwhite)/3; % width of all sinusoid plots
y_origin = 1; % start at top of graph area
%=======================================================
% Plot the unwindowed sinusoid
x_origin = x1;
y_origin = y_origin -y2 -height; % position of top row
subplot("position",[x_origin y_origin width1 height])
plot((-32*I:96*I), signal1I, "color","black")
xlim([-32 96]*I) %ylim([-2 2])
set(gca, "xaxislocation","origin")
xlabel("unwindowed")
%=======================================================
% Plot the 13-cycle sinusoid & rectangular window
x_origin = x_origin + width1 + ws;
subplot("position",[x_origin y_origin width1 height])
plot(0:length(window1)-1, window1, "color","blue")
xlim([-32 96]*I) %ylim([-2 2])
set(gca, "xaxislocation","origin")
hold on
plot((-32*I:96*I), filter, "color","black", "linewidth",2)
xlabel("13 cycles")
%=======================================================
% Plot the 13½-cycle sinusoid & rectangular window
x_origin = x_origin + width1 + ws;
subplot("position",[x_origin y_origin width1 height])
plot(0:length(window2)-1, window2, "color","red")
xlim([-32 96]*I) %ylim([-2 2])
set(gca, "xaxislocation","origin")
hold on
plot((-32*I:96*I), filter, "color","black", "linewidth",2)
%xlabel("13½ cycles") % doesn't work
%=======================================================
% Compute and plot Fourier transforms of the 2 sinusoids
x_origin = x1;
y_origin = y_origin -dy -height;
width2 = 1 -x1 -x2;
subplot("position",[x_origin y_origin width2 height])
N = samples_per_DTFT;
Hz_per_bin = samples_per_sec/N;
S1 = abs(fft(signal1,N));
S1 = 20*log10(S1(1:N/2));
S1 = max(0,S1);
plot((0:length(S1)-1)*Hz_per_bin, S1, "color","blue", "linewidth",1);
ylim([0 max(S1)+6])
xlim([0 samples_per_sec/2])
set(gca, "xtick",0:DFT_display_bins)
% set(gca, "ytick",0:10:ylim(2)) % no, no, no. It redefines ylim.
set(gca, "ytick",0:10:(max(S1)+6))
hold on
S2 = abs(fft(signal2,N));
S2 = 20*log10(S2(1:N/2));
S2 = max(0,S2);
plot((0:length(S2)-1)*Hz_per_bin, S2, "color","red", "linewidth",1);
% Insert delta function for unwindowed transform
stem(13, 35, "^", "MarkerSize",5+ds, "linewidth",2, "color","black", "markeredgecolor","black", "markerfacecolor","black")
ylabel("decibels")
xlabel('\leftarrow frequency \rightarrow')
%=======================================================
% Replot 13-cycle sinusoid
y_origin = y_origin -dy -height;
subplot("position",[x_origin y_origin width1 height])
plot(0:length(window1)-1, window1, "color","blue")
xlim([0 length(window1)-1]) %ylim([-2 2])
set(gca, "xaxislocation","origin")
hold on
% Overlay continuous sinusoid with discrete samples
plot(0:I:samples_per_DFT*I-1, signal1, "color","blue", ".", "MarkerSize",5+ds)
xlabel("discrete-time (sampled)")
%=======================================================
% Re-plot the Fourier transform, but truncate it to fit a smaller space
x_origin = x_origin + width1 + ws;
width3 = 1 - x_origin -x2;
subplot("position",[x_origin y_origin width3 height])
Hz_per_bin = samples_per_sec/samples_per_DTFT;
% DFT_display_bins = 32. Truncate plot to 22 bins:
N = 22.5/32*length(S1);
plot((0:N-1)*Hz_per_bin, S1(1:N), "color","blue", "linewidth",1);
ylim([0 max(S1)+6])
xlim([0 N-1]*Hz_per_bin);
set(gca, "xtick",0:22)
hold on
% Compute and overlay the discrete DFT values
N = samples_per_DFT;
Hz_per_bin = samples_per_sec/N;
S = abs(fft(signal1,N));
S = 20*log10(S(1:N/2));
S = max(0,S);
N = 23;
plot((0:N-1)*Hz_per_bin, S(1:N), "color","blue", ".", "MarkerSize",10+dl);
set(gca, "xtick",(0:N-1)*Hz_per_bin)
%=======================================================
% Replot 13½-cycle sinusoid
x_origin = x1;
y_origin = y_origin -dy -height;
subplot("position",[x_origin y_origin width1 height])
plot(0:length(window2)-1, window2, "color","red")
xlim([0 length(window2)-1]) %ylim([-2 2])
set(gca, "xaxislocation","origin")
hold on
% Overlay continuous sinusoid with discrete samples
plot(0:I:samples_per_DFT*I-1, signal2, "color","red", ".", "MarkerSize",5+ds)
xlabel("discrete-time (sampled)")
%=======================================================
% Re-plot the Fourier transform, but truncate it to fit a smaller space
x_origin = x_origin + width1 + ws;
subplot("position",[x_origin y_origin width3 height])
Hz_per_bin = samples_per_sec/samples_per_DTFT;
% DFT_display_bins = 32. Truncate plot to 22 bins:
N = 22.5/32*length(S2);
plot((0:N-1)*Hz_per_bin, S2(1:N), "color","red", "linewidth",1);
ylim([0 max(S2)+6])
xlim([0 (N-1)*Hz_per_bin])
set(gca, "xtick",0:22)
hold on
% Compute and overlay the discrete DFT values
N = samples_per_DFT;
Hz_per_bin = samples_per_sec/N;
S = abs(fft(signal2,N));
S = 20*log10(S(1:N/2));
S = max(0,S);
N = 23;
plot((0:N-1)*Hz_per_bin, S(1:N), "color","red", ".", "MarkerSize",10+dl);
set(gca, "xtick",(0:N-1)*Hz_per_bin)
xlabel("DFT bins")
|
Historial del archivo
Haz clic sobre una fecha y hora para ver el archivo tal como apareció en ese momento.
| Fecha y hora | Miniatura | Dimensiones | Usuario | Comentario | |
|---|---|---|---|---|---|
| actual | 13:05 26 ene 2020 | | 1080 × 664 (170 kB) | Bob K | fixed missing yticks (2nd row) |
| 23:49 25 ene 2020 |  | 1080 × 664 (166 kB) | Bob K | change frame background to gray using toolkit "qt", instead of gnuplot | |
| 22:24 12 nov 2018 |  | 1080 × 652 (161 kB) | Bob K | Move frequency from 13¼ to 13½ cycles (per window width), and denote the subsequent scalloping. | |
| 17:35 11 nov 2018 |  | 1080 × 652 (157 kB) | Bob K | User created page with UploadWizard |
Usos del archivo
La siguiente página usa este archivo:
Uso global del archivo
Las wikis siguientes utilizan este archivo:
- Uso en en.wikipedia.org
- Uso en uk.wikipedia.org