Archivo:2017- Donald Trump - graph - false or misleading claims.png
Ver la imagen en su resolución original (2332 × 2657 píxeles; tamaño de archivo: 597 kB; tipo MIME: image/png)

|
Esta imagen debería volverse a crear como imágenes vectoriales SVG. Esto proporciona muchas ventajas, véase Commons:Media for cleanup (en inglés) para más información. Si ya hay una versión SVG de esta imagen disponible, por favor súbala a Commons. Tras subirla, reemplace esta plantilla con la plantilla
{{vector version available|nuevo nombre de imagen.svg}} en esta imagen. |
Resumen
| Descripción |
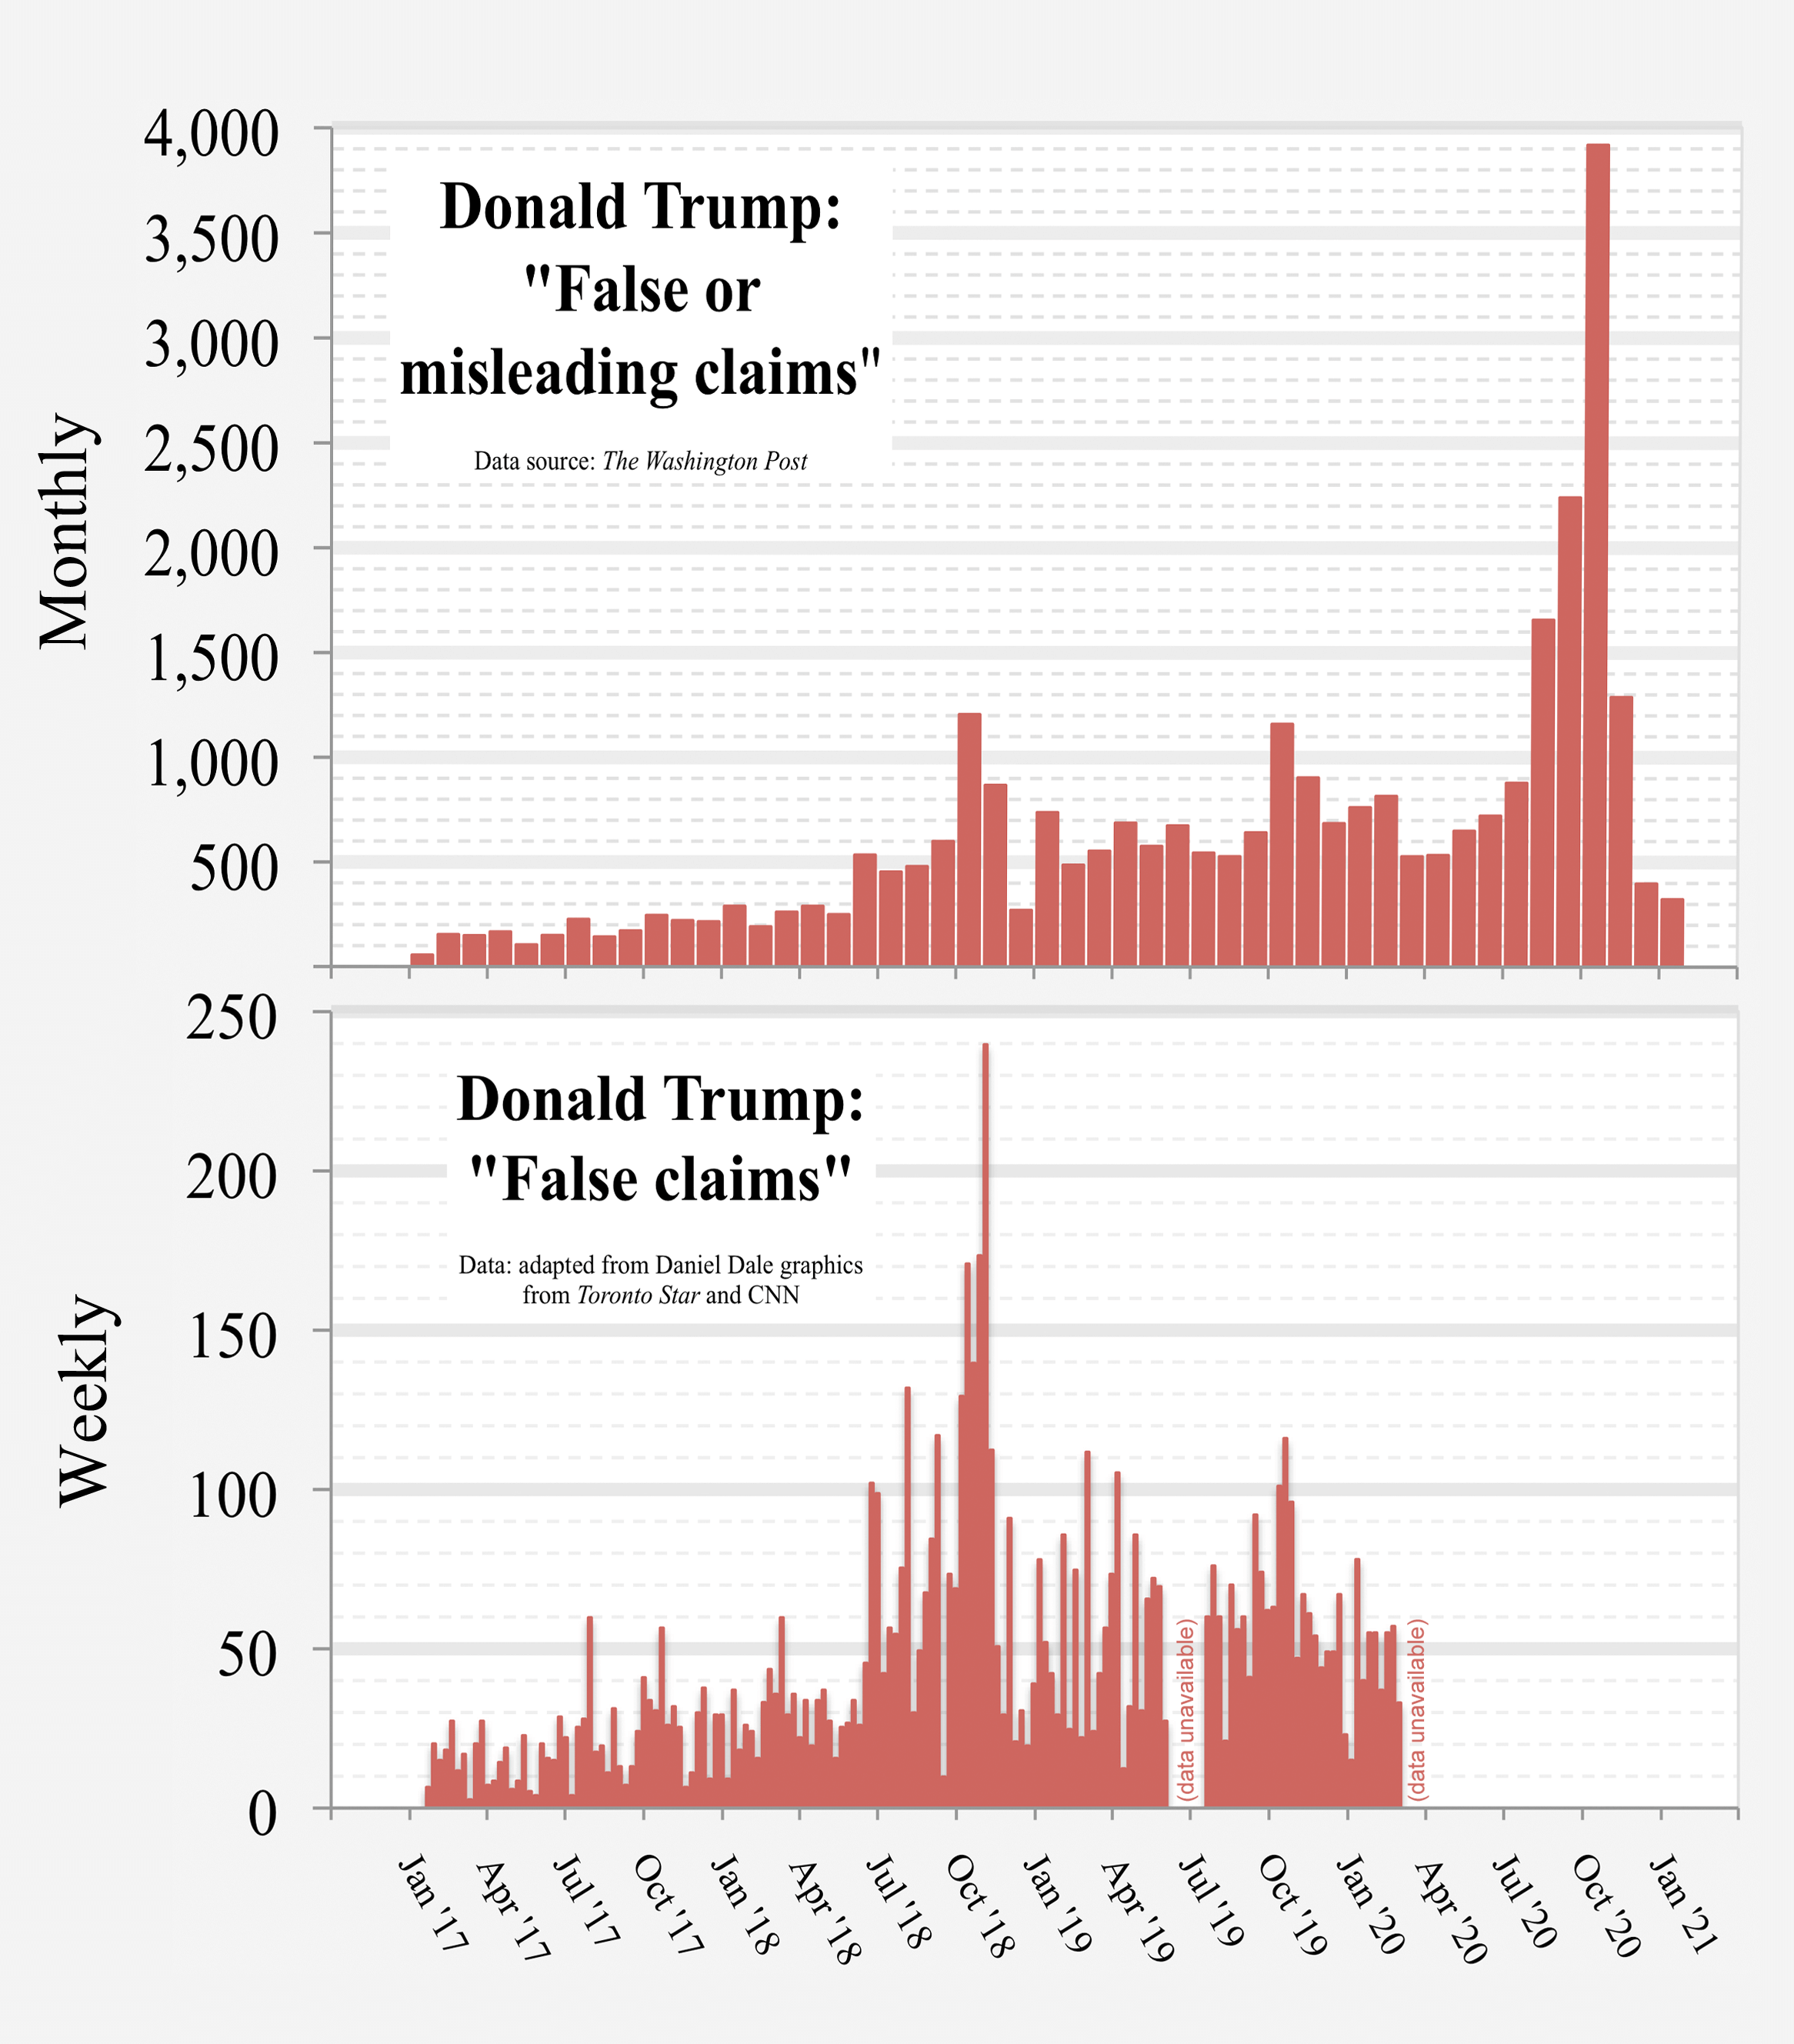
English: Charts showing findings of two newspapers' fact checkers re the number of "false or misleading" or "false" claims by U.S. President Donald Trump.
Data:
|
| Fecha | |
| Fuente | Trabajo propio |
| Autor | RCraig09 |
| Otras versiones |
 Consolidated data into a single graph |
Data used to form the charts
Washington Post
| Click at right to show/hide The Washington Post data |
|---|
|
The Washington Post data:
|
Toronto Star and CNN data =
| Click at right to show/hide data adapted from Toronto Star and CNN graphics |
|---|
|
Data adapted by uploader from a Toronto Star graphic (is not the original data used to generate the newspaper's graphic): Week False claims (data unavailable for June and early July) 2019-07-19 60 (CNN source was dated March 9, 2020) Daniel Dale's (CNN) original source specified numbers daily; uploader added the values within each week to arrive at the foregoing weekly figures, with each week ending on a Friday to conform to Dale's earlier work at Toronto Star which also ended on Fridays.
|
Licencia
- Eres libre:
- de compartir – de copiar, distribuir y transmitir el trabajo
- de remezclar – de adaptar el trabajo
- Bajo las siguientes condiciones:
- atribución – Debes otorgar el crédito correspondiente, proporcionar un enlace a la licencia e indicar si realizaste algún cambio. Puedes hacerlo de cualquier manera razonable pero no de manera que sugiera que el licenciante te respalda a ti o al uso que hagas del trabajo.
- compartir igual – En caso de mezclar, transformar o modificar este trabajo, deberás distribuir el trabajo resultante bajo la misma licencia o una compatible como el original.
Historial del archivo
Haz clic sobre una fecha y hora para ver el archivo tal como apareció en ese momento.
| Fecha y hora | Miniatura | Dimensiones | Usuario | Comentario | |
|---|---|---|---|---|---|
| actual | 05:34 9 feb 2021 | | 2332 × 2657 (597 kB) | RCraig09 | Version 17: updating to include data for January 2021. Squaring off tops of columns and narrowing gaps between columns. Reduced filesize at tinypng.com |
| 07:31 16 ene 2021 |  | 2332 × 2657 (560 kB) | RCraig09 | Version 16: Adding datapoints for Nov and Dec 2020. Reducing PNG filesize at tinypng.com (reduces number of bits per pixel). | |
| 23:20 5 ene 2021 |  | 2332 × 2657 (1,64 MB) | RCraig09 | Version 15: Update to include Washington Post date through end of October 2020. | |
| 23:20 20 dic 2020 |  | 2332 × 2657 (1,67 MB) | RCraig09 | Version 14: Updated to include Washington Post data through end of September 2020. | |
| 07:21 16 nov 2020 |  | 2332 × 2657 (1,66 MB) | RCraig09 | Version 13: Updating graph to include exact value for August 2020 that no longer involves extrapolation for the last four days of the month. Washington Post added a few more days to their database. | |
| 23:06 21 oct 2020 |  | 2332 × 2657 (1,66 MB) | RCraig09 | Version 12: Updating to include July and August data from Washington Post. Top panel's vertical had to be compressed to accommodate new high in data value (for August 2020). | |
| 06:01 13 jul 2020 |  | 2332 × 2657 (1,43 MB) | RCraig09 | Update to include Washington Post data through end of June 2020. | |
| 05:09 5 jun 2020 |  | 2332 × 2657 (1,49 MB) | RCraig09 | Version 10: Update to include Washington Post data for April and May 2020 | |
| 21:12 15 abr 2020 |  | 2332 × 2657 (1,77 MB) | RCraig09 | Version 9: Updating with CNN Daniel Dale data for Jan and Feb 2020. | |
| 05:35 15 abr 2020 |  | 2332 × 2657 (1,83 MB) | RCraig09 | Version 8: Adding "monthly" and "weekly" to vertical axes. |
Usos del archivo
La siguiente página usa este archivo:
Uso global del archivo
Las wikis siguientes utilizan este archivo:
- Uso en en.wikipedia.org
- Uso en fa.wikipedia.org
- Uso en ru.wikipedia.org
- Uso en vi.wikipedia.org
- Uso en zh.wikipedia.org